> ## Documentation Index
> Fetch the complete documentation index at: https://docs.weeziq.com/docs/llms.txt
> Use this file to discover all available pages before exploring further.
# Dashboard
> Your real-time command center for monitoring chatbot performance, key metrics, and conversation trends.
The Dashboard is the first thing you see when you log into your WeezIQ workspace. It provides a real-time snapshot of how your chatbot is performing, with key metrics and visual charts to help you stay on top of your customer interactions.
## Overview
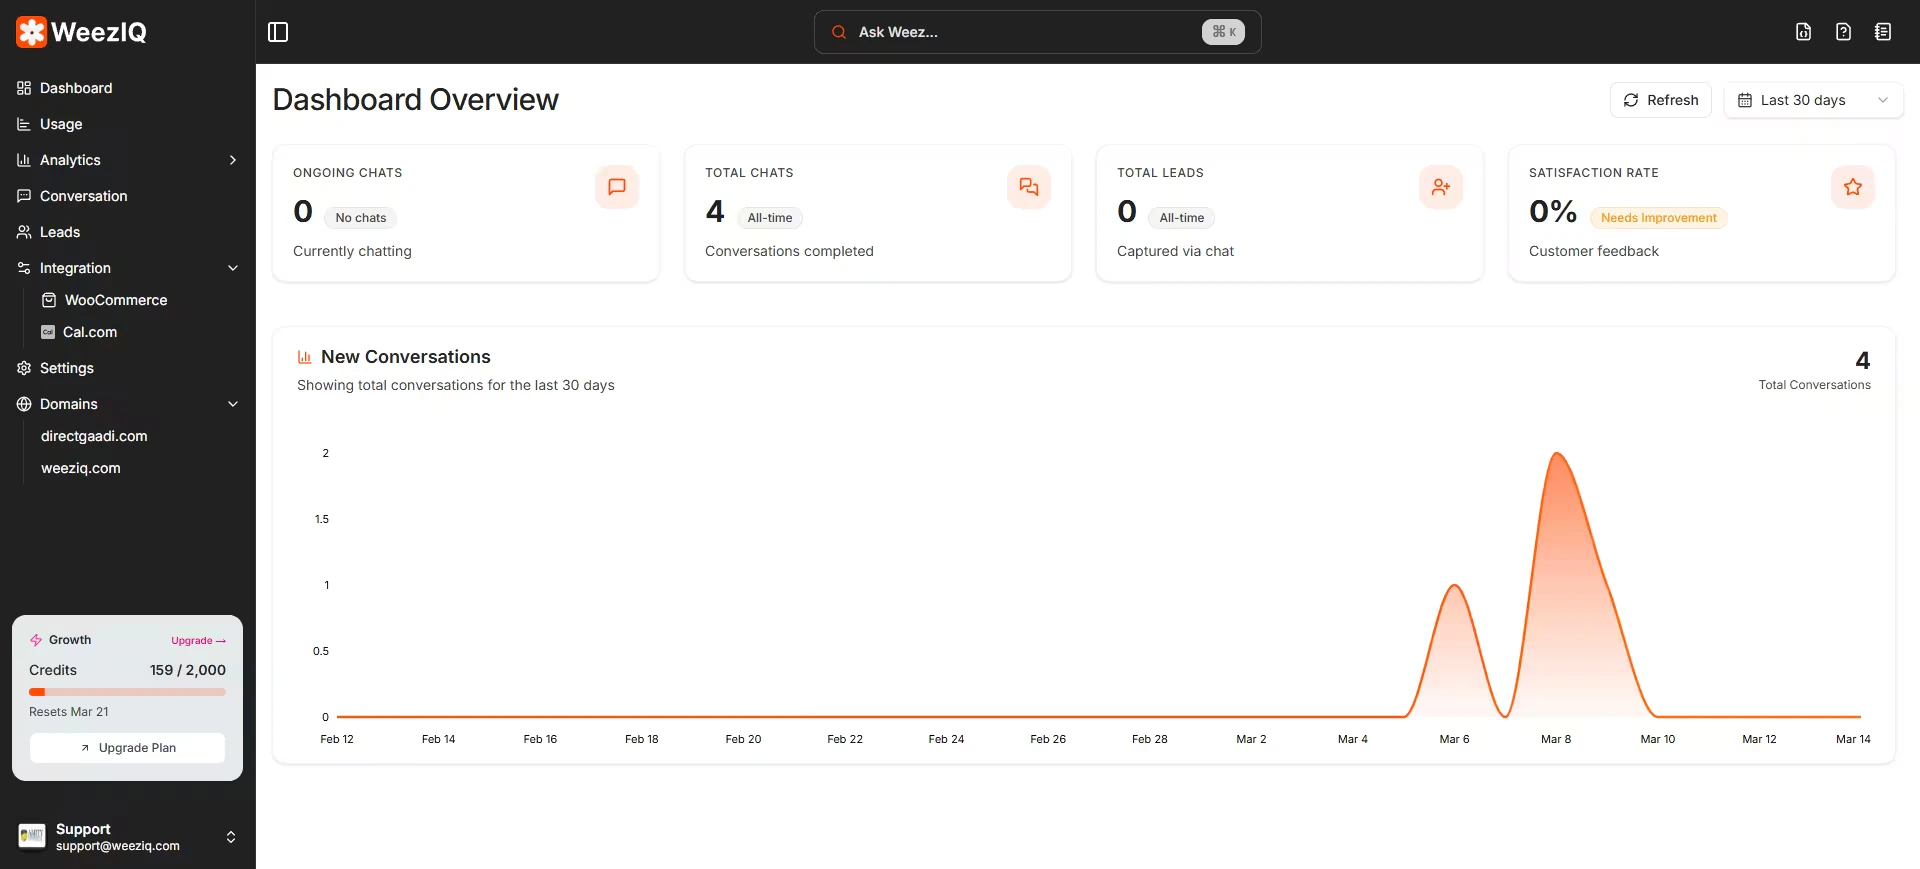 The Dashboard gives you a bird's-eye view of activity across all your domains. At the top, you will find a **time range filter** that lets you narrow the data to a specific period (today, last 7 days, last 30 days, etc.). There is also a manual **Refresh** button to pull the latest data on demand.
## Stats Cards
Four stats cards sit at the top of the page, each representing a critical metric:
The total number of visitors who submitted their contact information through the chat.
The number of chat sessions that are currently active or were recently active.
The cumulative count of all chat conversations that have taken place.
The percentage of positive ratings given by users based on their chat experience.
These numbers update based on the time range you select.
## New Conversations Chart
Below the stats cards is an **area chart** that visualizes the volume of new conversations over time. This chart helps you identify trends, like increased activity on certain days of the week or spikes after a marketing campaign.
You can adjust the chart's time range using the same filter at the top of the page.
## Usage Page
The **Usage** page, accessible from the sidebar, gives you a more detailed breakdown of your AI credit consumption.
The Usage page tracks how many messages the AI has processed, which models were used, and how close you are to your plan's monthly limits. This is especially useful for managing costs and deciding whether to upgrade your subscription tier.
The Dashboard gives you a bird's-eye view of activity across all your domains. At the top, you will find a **time range filter** that lets you narrow the data to a specific period (today, last 7 days, last 30 days, etc.). There is also a manual **Refresh** button to pull the latest data on demand.
## Stats Cards
Four stats cards sit at the top of the page, each representing a critical metric:
The total number of visitors who submitted their contact information through the chat.
The number of chat sessions that are currently active or were recently active.
The cumulative count of all chat conversations that have taken place.
The percentage of positive ratings given by users based on their chat experience.
These numbers update based on the time range you select.
## New Conversations Chart
Below the stats cards is an **area chart** that visualizes the volume of new conversations over time. This chart helps you identify trends, like increased activity on certain days of the week or spikes after a marketing campaign.
You can adjust the chart's time range using the same filter at the top of the page.
## Usage Page
The **Usage** page, accessible from the sidebar, gives you a more detailed breakdown of your AI credit consumption.
The Usage page tracks how many messages the AI has processed, which models were used, and how close you are to your plan's monthly limits. This is especially useful for managing costs and deciding whether to upgrade your subscription tier.